
Download a full resolution version here.
This visualization shows variation in regional and state and household
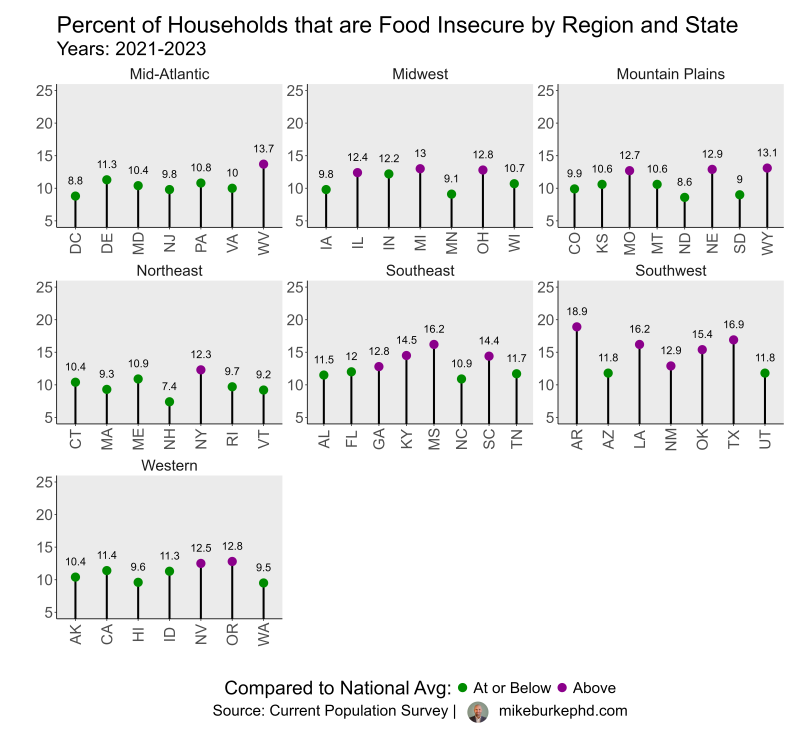
food insecurity rates in 2023. Food insecure households experience disruptions
in the quality and quantity of the household food supply due to a lack of resources.
Translation: food insecure households struggle to afford the food they need to feed
their family.
I’ve been thinking about state and regional variation in the U.S. For most issues, we
can imagine that they will vary by state and region. Oftentimes, however, national
level estimates get the limelight. For example, unemployment, poverty, and rates of
HIV infection. And I get it: attention spans are short, we all just want that one number
that summarizes the issue. What I think happens though, is that variation gets put in
the background, and the issue get homogenized.
Here I put state and regional variation in the limelight. I also respect the national
perspective, by comparing states to the national average. The challenge was putting all
50 states (and DC!) and the seven regions in one graph.
This graph was fun to make. Overall, I think it does a couple things well:
- Differences between states within a region and general differences between regions are apparent
- Easy to see how states compare to the national average
A drawback is that comparing states in different regions is a little difficult.
Made with R!